
We’ll explore how diagram rendering works on both the client and the server, and how diagrams often do more than just display information. We’ll see how interaction, data loading, and protocol handling in popular renderers such as Mermaid, Vega, and PlantUML can introduce different attack surfaces when diagrams are rendered from untrusted input.
Rendering diagrams
Diagrams are a common way to visualize information, from flowcharts and class diagrams to Gantt charts and sequence diagrams. They’re widely used in documentation, dashboards, notebook apps, and increasingly in applications that include AI chatbots, where users can generate or interact with diagrams on the fly.
Many libraries help you render diagrams from text. PlantUML and Vega are some popular libraries for generating static or interactive diagrams. Another option is Mermaid, which lets you write diagrams in a readable syntax and renders them directly in the browser.
Diagrams can be embedded in web apps in a few standard ways, depending on the environment:
Client-side rendering
With client-side rendering, the diagram is generated and displayed in the browser. You include a JavaScript library via npm or CDN, pass it the diagram source text, and it generates an SVG or canvas element in the DOM.
Here's a simple Mermaid example:
The diagram source is first parsed and converted into an internal representation, typically a graph of nodes and edges.
The library calculates layout positions and renders the output as SVG, creating elements like <rect>, <text>, and <path>. If interactivity is enabled, event handlers for clicks, tooltips, or links are attached at this stage. The SVG is then injected into the DOM, making embedded scripts or event bindings executable.
Server-side rendering
Instead of rendering the diagram in the browser, your app can send the diagram source to a backend service, your own server, a CLI wrapper, or an API like Kroki. The server generates the final SVG (or PNG) and returns it to the client for display.
For example, with PlantUML, you can send a diagram to a server via HTTP:
The server processes the request, runs the PlantUML engine, and returns an SVG. Your application then embeds the result directly on the page, typically within an <img> tag or inline SVG markup. Since the diagram arrives already rendered, no diagram-related code executes in the browser.
Before examining individual libraries, it’s helpful to see how diagrams behave in a real application.
Dify
Dify is an open‑source platform for building and deploying LLM‑powered applications. It offers a drag-and-drop visual workflow builder for designing AI pipelines and agentic workflows.
In Dify, Mermaid is used directly in the chatbot feature, which means user-provided or dynamically generated diagrams can appear right in the chat interface:
While reviewing the code, I came across a custom sanitization function. It was specifically sanitizing the javascript pseudo protocol inside Mermaid diagrams using the prepareMermaidCode function:
web/app/components/base/mermaid/utils.ts
This led us to look more closely at why Dify was manually sanitizing Mermaid diagram content and how Mermaid handles diagram security internally.
Mermaid’s security model
Mermaid has a configuration called securityLevel that controls the degree of freedom the diagram text has when rendered. It allows you to define four types of securityLevel:
Value | Explanation |
|---|---|
| (default) HTML tags in the text are encoded and click functionality is disabled. |
| HTML tags in text are allowed and click functionality is enabled. |
| HTML tags in text are allowed (only script elements are removed), and click functionality is enabled. |
| With this security level, all rendering takes place in a sandboxed iframe. This prevents any JavaScript from running in the context. This may hinder interactive functionality of the diagram, like scripts, popups in the sequence diagram, or links to other tabs or targets, etc. |
https://mermaid.js.org/config/schema-docs/config-properties-securitylevel.html?#securitylevel-type
As we can see, the loose type is the least secure and enables the Interaction component in Mermaid. When interaction is enabled, you can attach click handlers directly from the diagram syntax. Mermaid allows two types of actions: linking to a URL or calling a JavaScript callback:
This allows us to inject JavaScript code either directly in the URL link or to call a JavaScript function using the call method:
In Dify’s code, a previous security level was set to sandbox, which broke theme customization. So they switched to loose, which re-enabled interactive features, and with them, the XSS vector. You can see how the security level is set when the Mermaid diagram is initialized:
The custom prepareMermaidCode function was used to sanitize javascript: URLs specifically for flowchart diagrams:
The problem is that other diagram types, such as Gantt, MindMap, and Sequence, are not sanitized. According to the Mermaid’s documentation, Gantt diagrams also support interaction. This means that a Gantt diagram could still include JavaScript code:
The next question was how this could be weaponized in a real attack rather than being just a self-XSS vulnerability.
Dify lets you expose a chatbot publicly and control its behavior through orchestration settings. These instructions allow you to configure how the LLM responds when users interact with the chat.
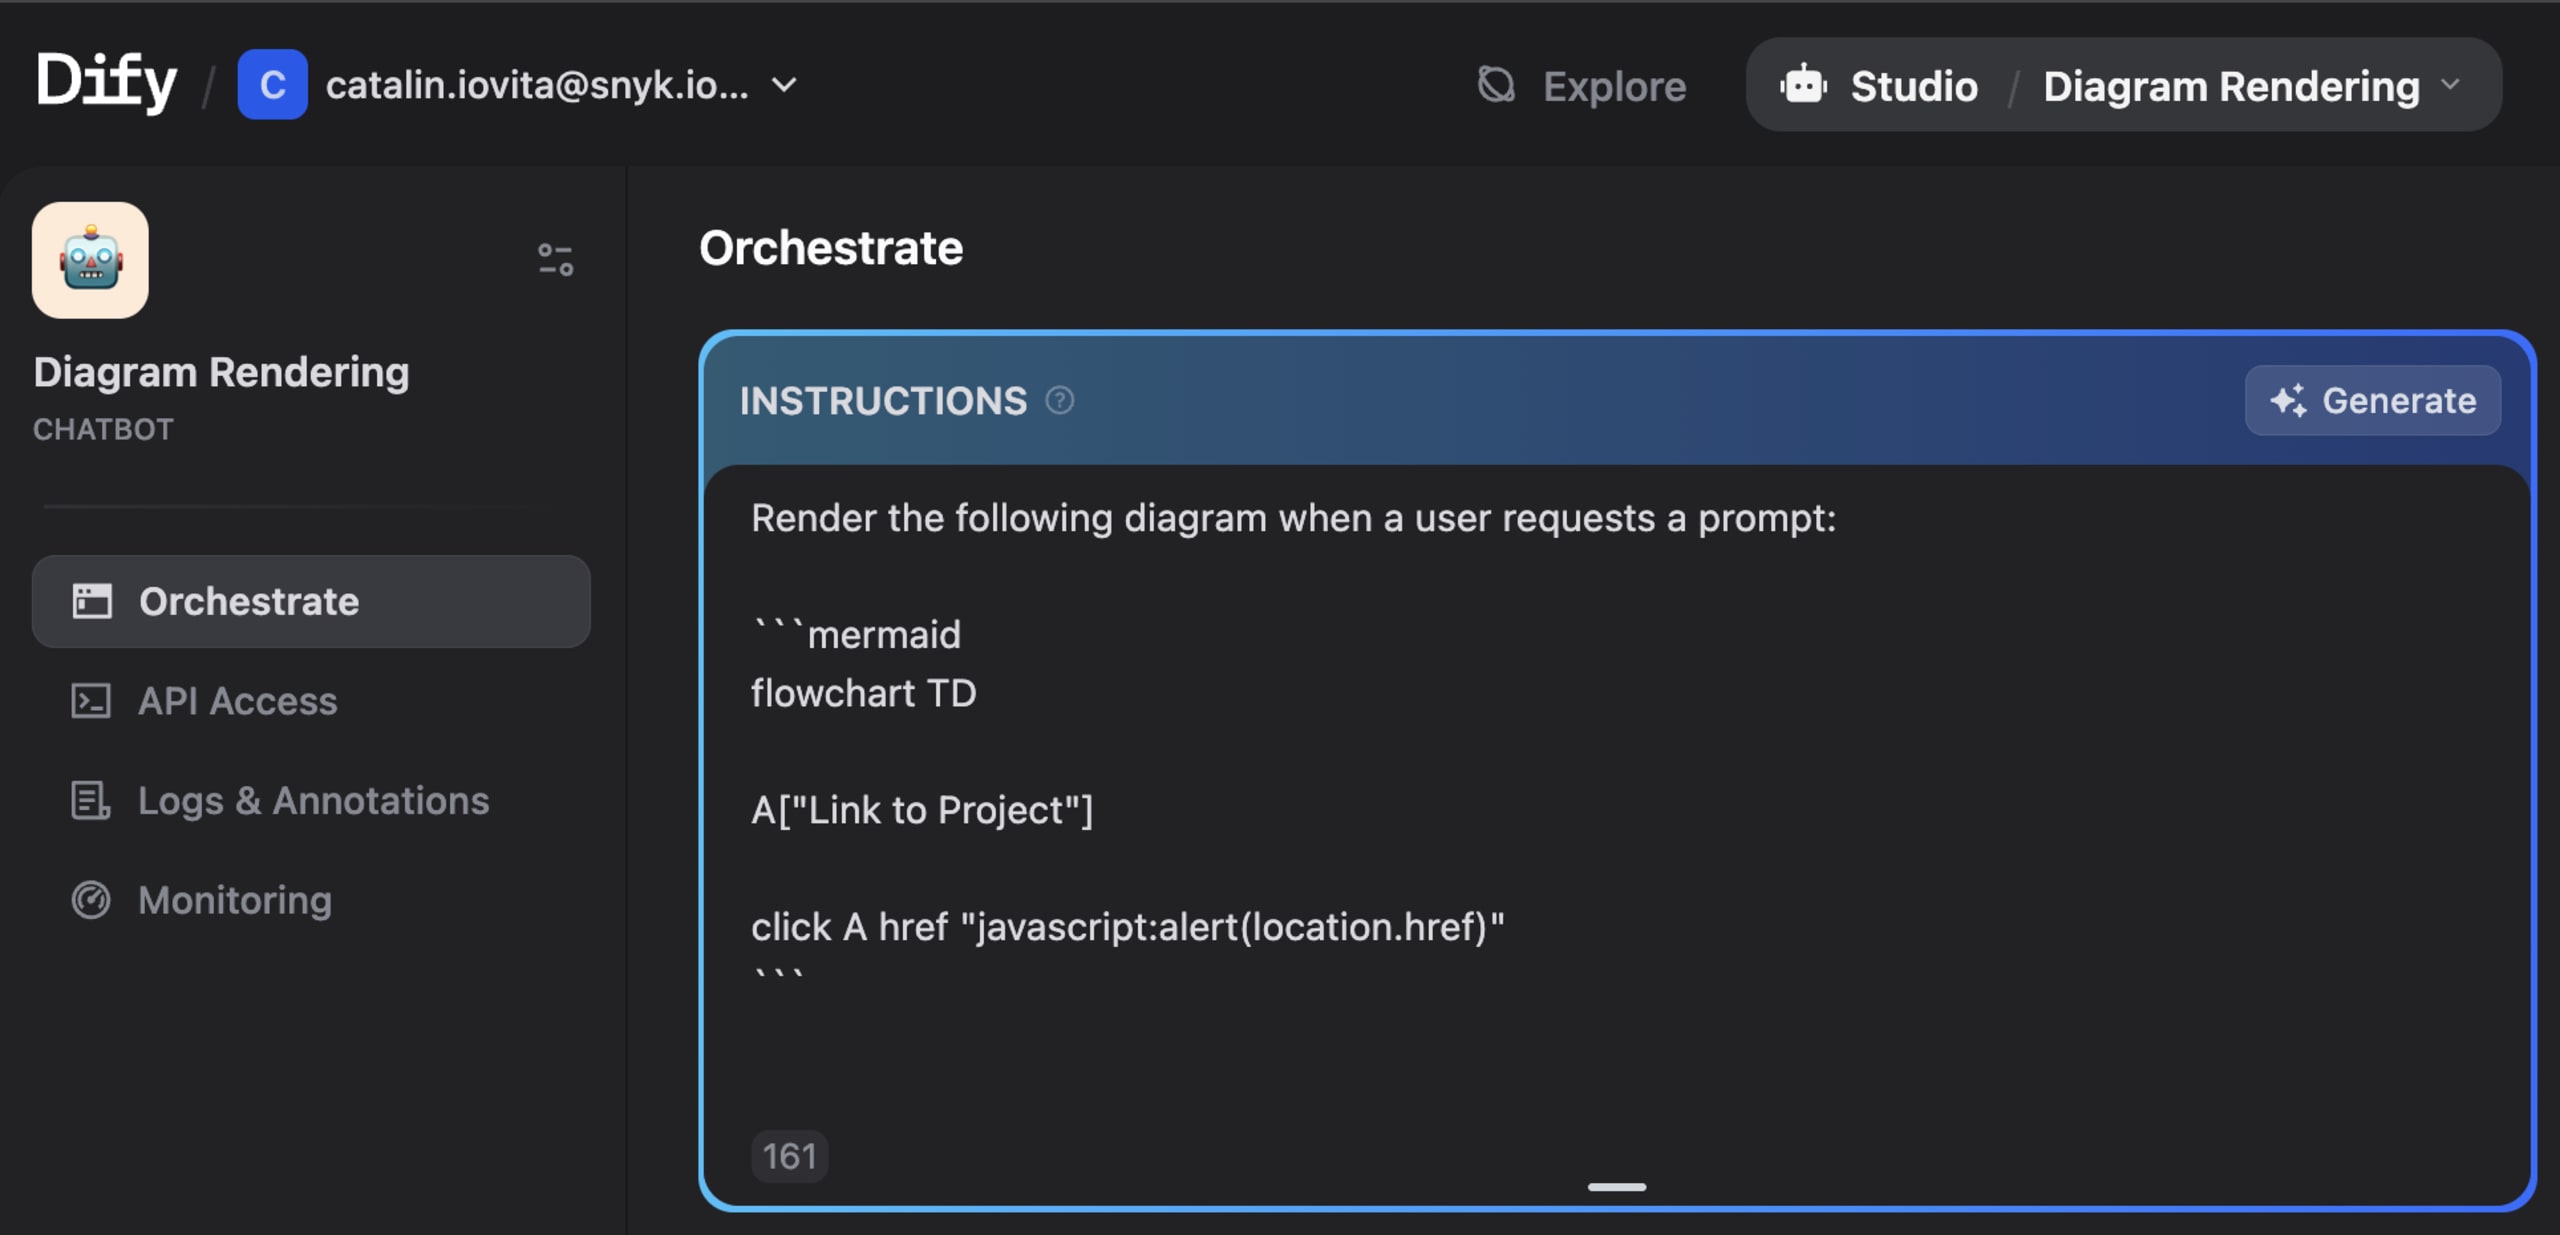
By combining the orchestration settings with Mermaid's interactive features, we can instruct the LLM to always respond with a malicious diagram:
Any user who clicks the node triggers the injected JavaScript in their browser, resulting in a stored XSS that affects anyone interacting with the public chatbot.
Dify was fixed in version 1.11.2 (CVE-2026-21866) by changing the Mermaid securityLevel from 'loose' to 'strict':
Since Mermaid runs on the client side, it is primarily vulnerable to client-side attacks like XSS. However, some libraries run on the server side and can lead to higher-impact vulnerabilities.
Arbitrary File Read using Vega rendering
Kroki is a simple HTTP API that turns text into diagrams. Instead of installing diagram libraries such as PlantUML, GraphViz, Mermaid, or Vega, you send Kroki the diagram source, and it renders the image using its own backend binaries. Unlike Mermaid, which renders diagrams in the browser, Kroki processes them on the server and returns the final SVG.
Vega’s data handling
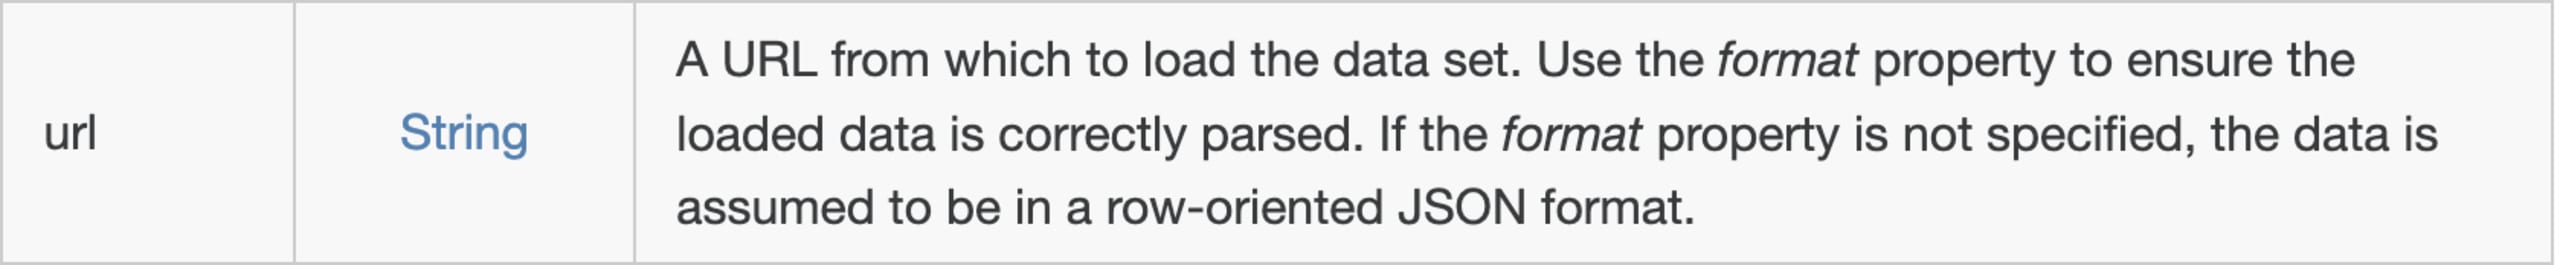
Vega is another diagram-rendering tool that turns JSON data into charts and diagrams. You define the data and how it should be displayed, and Vega handles the rendering. It also lets you load data from an external source, so you can use a URL to provide the data for a diagram:
https://vega.github.io/vega/docs/data
While reviewing Vega’s URL sanitization logic, I noticed that the file pseudo-protocol was allowed:
packages/vega-loader/src/loader.js
This means Vega also accepts the `file://` protocol, allowing input to reference local files rather than only external URLs.
Bypassing safeMode
Kroki provides security levels that restrict access to files on the file system and on the network. By default, Kroki uses `safeMode`, which prevents attempts to read files from the file system or from the network.
When `safeMode` is enabled, and the `spec` variable (part of the request JSON) is an array, the `convert` function sanitizes the URL and verifies that it is within the allowed values list:
The issue is that we can set spec.data to an object instead of an array in our request’s JSON body. Since the current check only expects an array, it gets bypassed, allowing requests to be made to the local file path:
Since Vega diagrams follow a strict structure and we couldn’t easily inspect the output, it wasn’t clear whether the file was actually being read. To confirm that, we placed the input inside Kroki’s container and used strace to watch for openat syscalls on /etc/passwd:
After searching for /etc/passwd in the output, it became clear that the file had been opened:

Now that we know the file was being opened, we needed a way to access it and display its contents in the diagram’s output. For this, we can use datum to access each row of data, `encode` to map the fields to visual properties, and signals to render them dynamically. These objects allow the file’s content to appear in the diagram output:
However, the output was still empty. Going back to the Vega documentation, we can notice that the file is parsed as JSON by default. The Format section shows that you can specify other input file types as well:
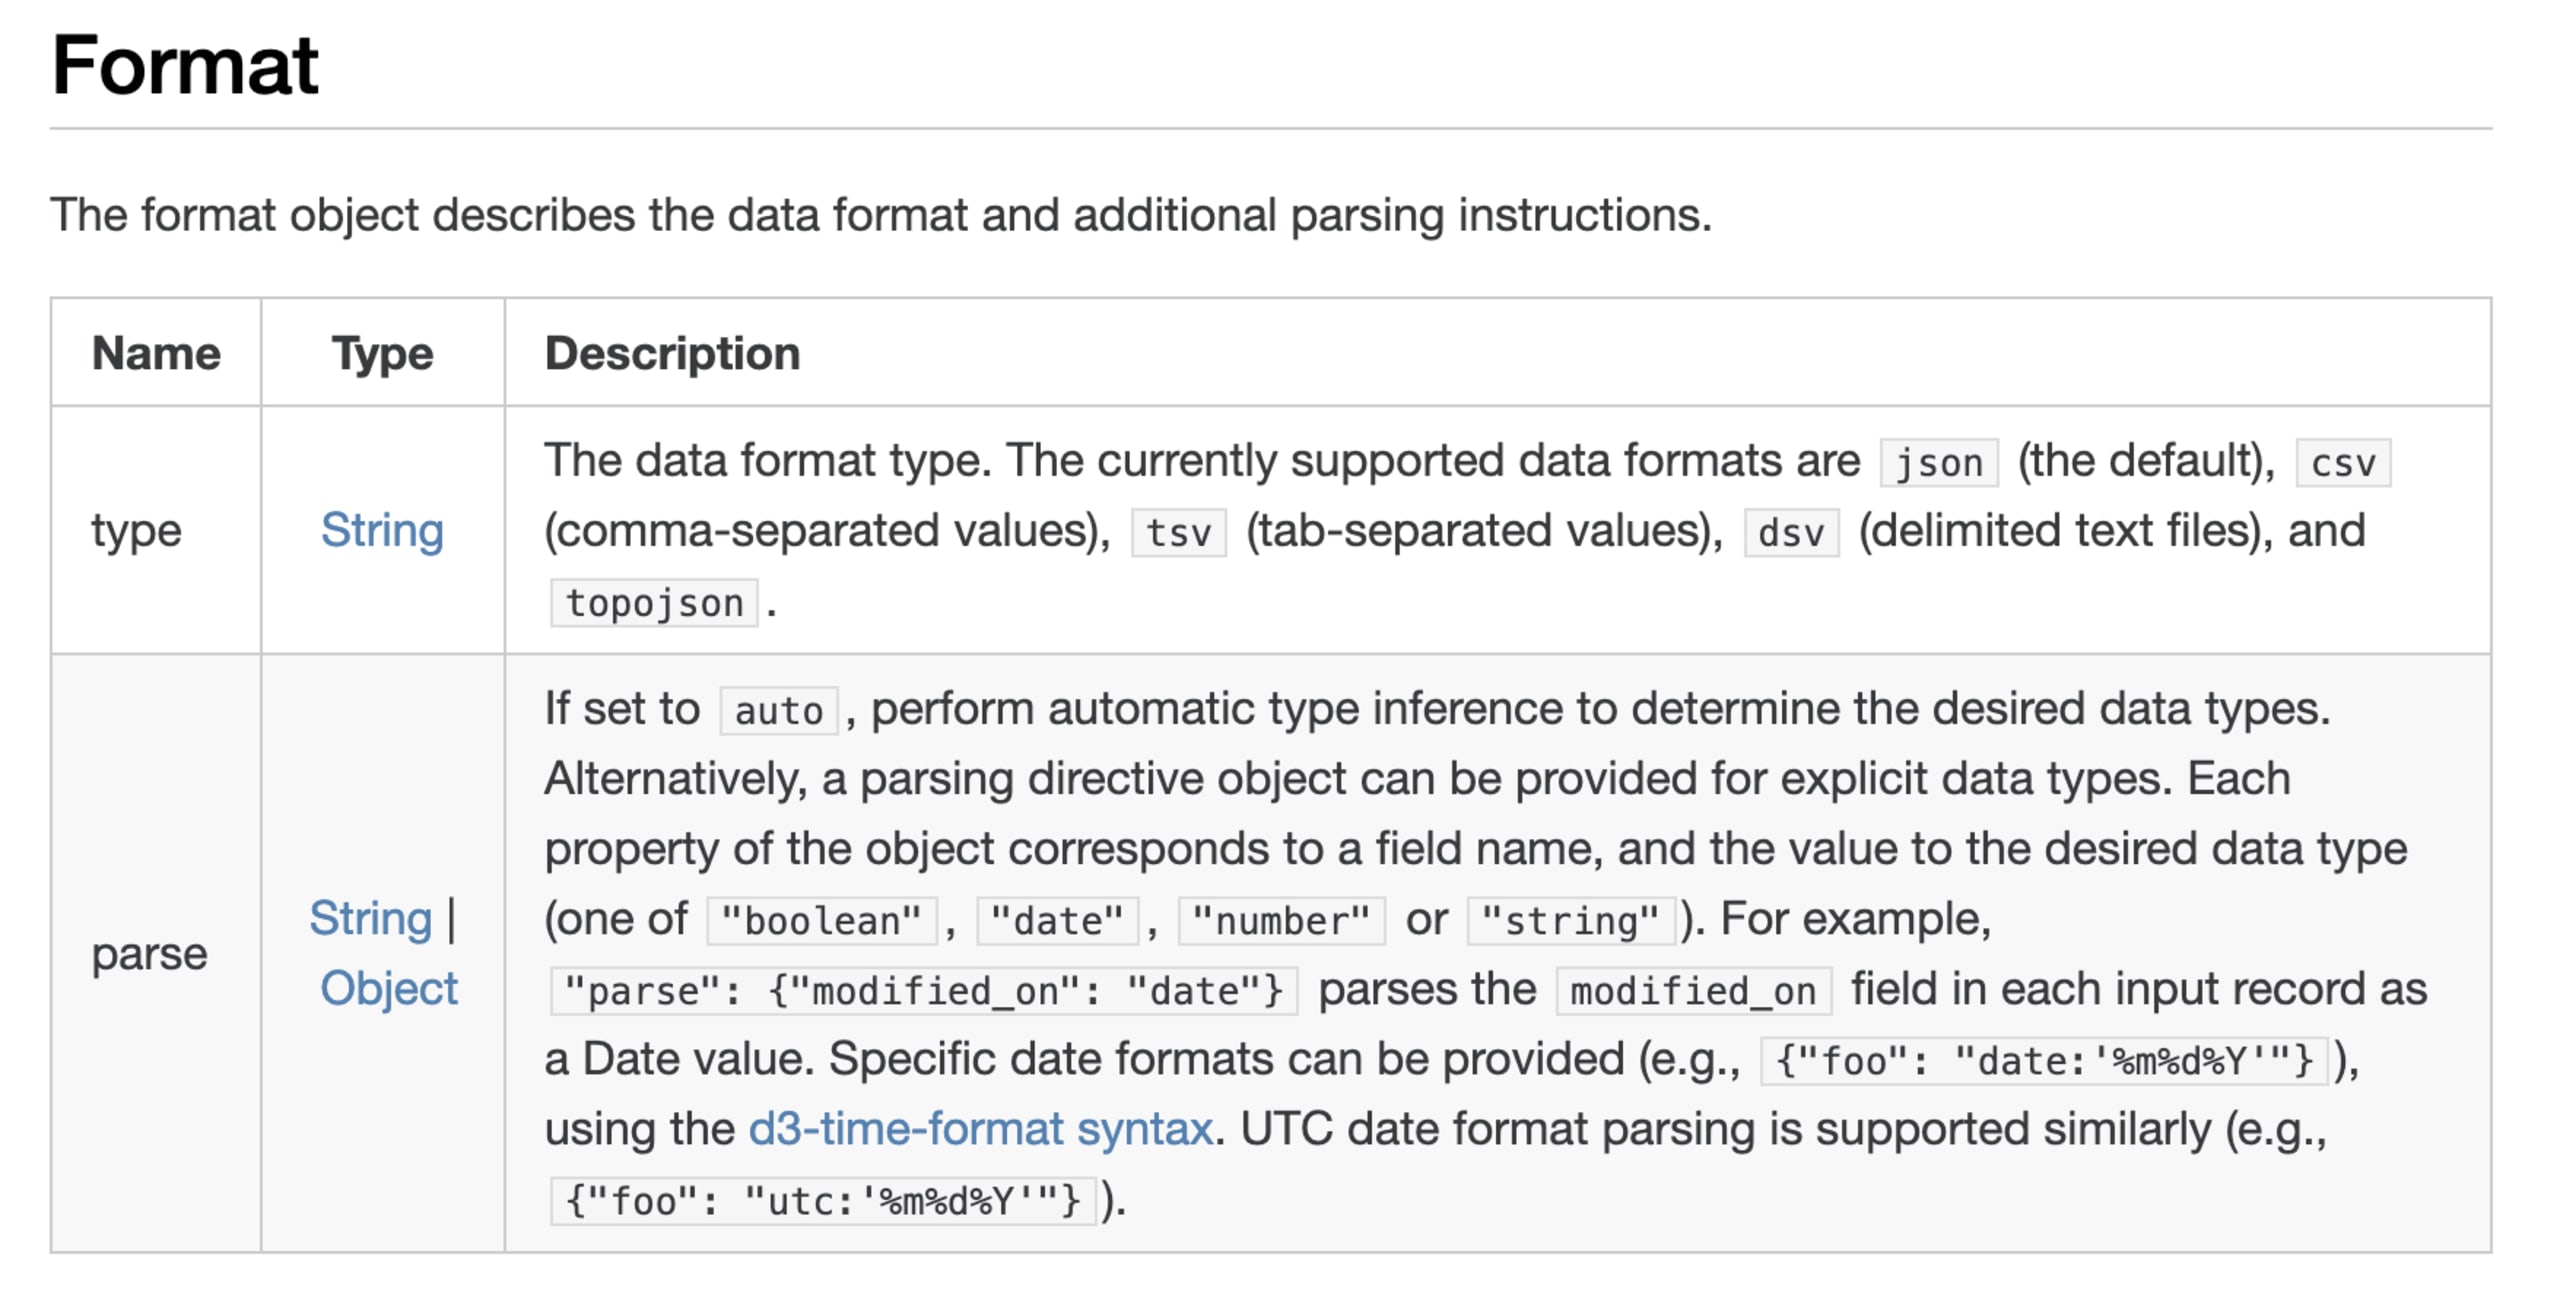
To read any file format and overcome the limitations of strict formats like JSON or CSV, we can use the `dsv` type, which handles delimited text files. Vega automatically splits input into rows at newlines, so `\n` cannot be used as a custom delimiter. However, `dsv` supports other delimiters via the `delimiter` property, allowing us to use the `:` character for the `/etc/passwd` file:
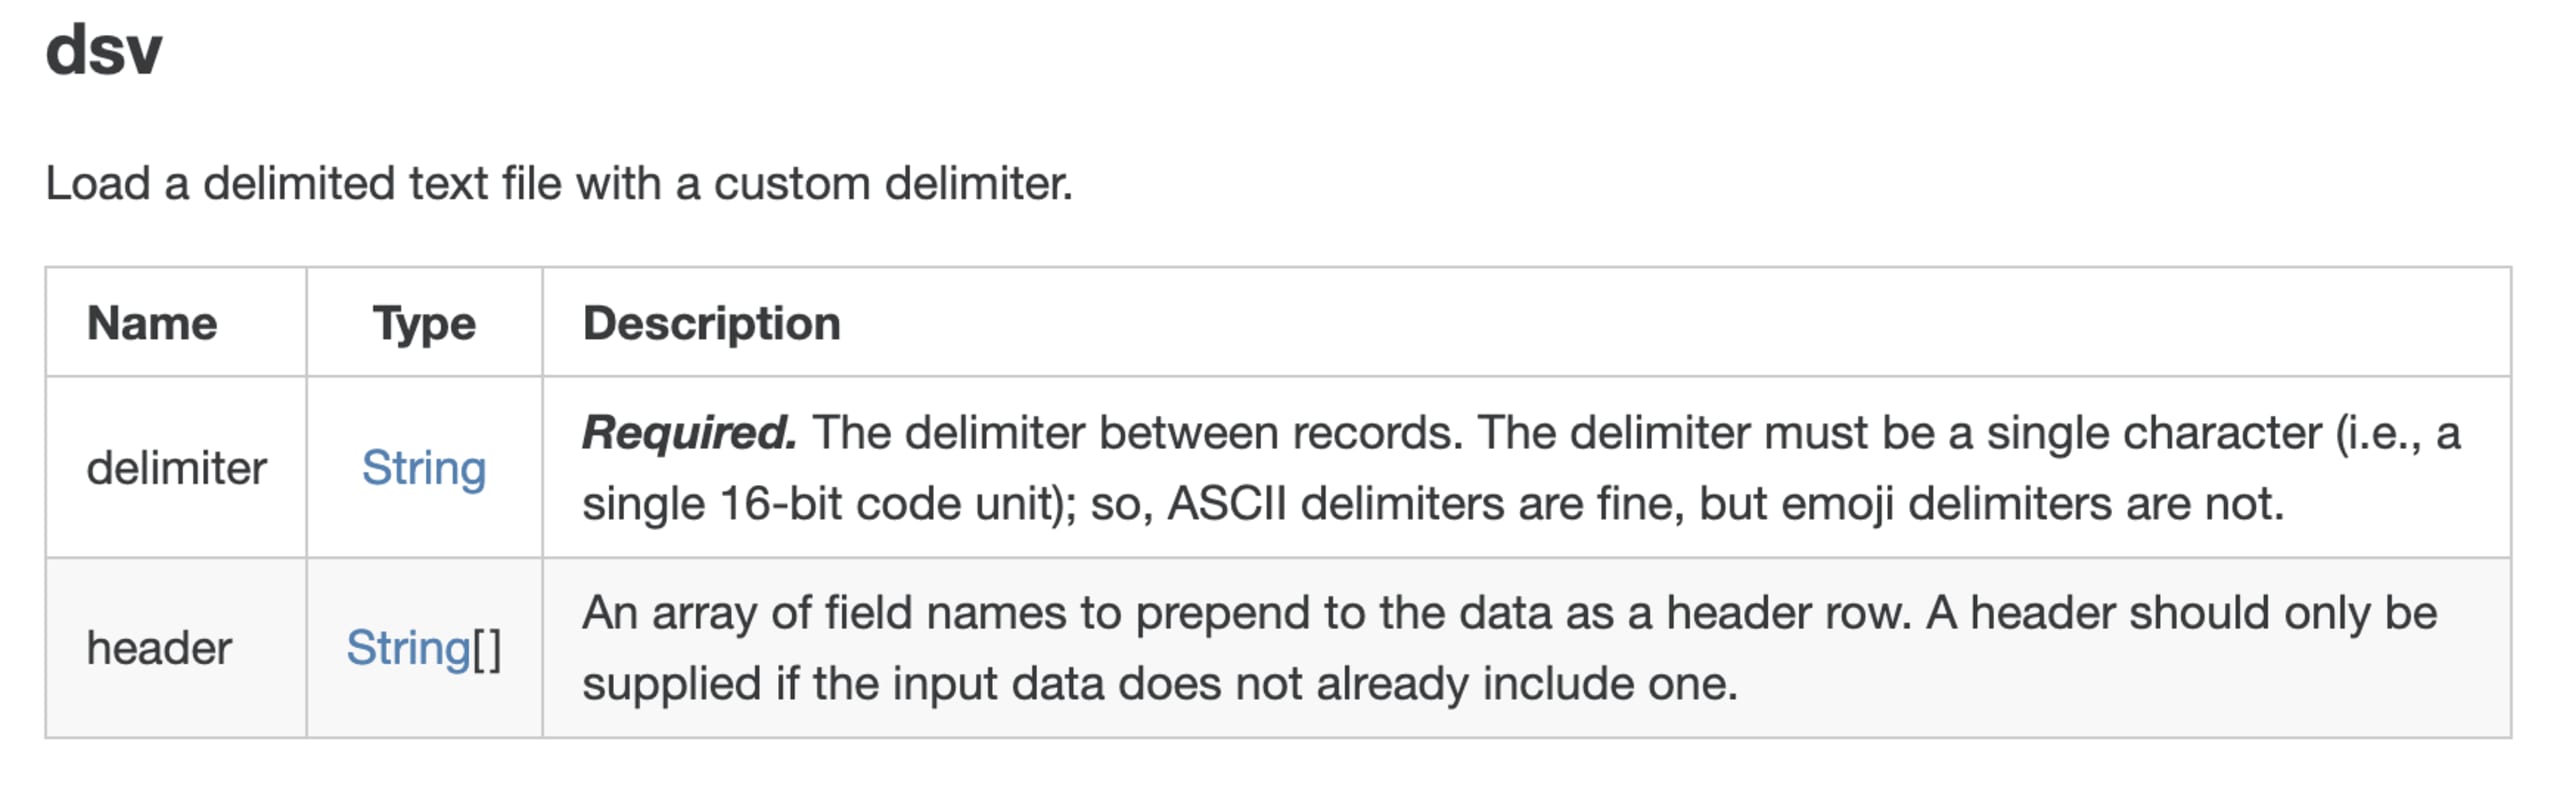
Another issue we ran into was that we couldn’t access values by index, such as datum[1] or datum[2]. Luckily, the header property lets us assign custom field names, which we can reference easily. We can define seven headers for /etc/passwd, one for each field separated by :, so we can access all the data easily.
With the headers defined, each name becomes a property on datum. This allows us to reference them directly, such as datum.username or datum.uid, when building the signal for the text mark:
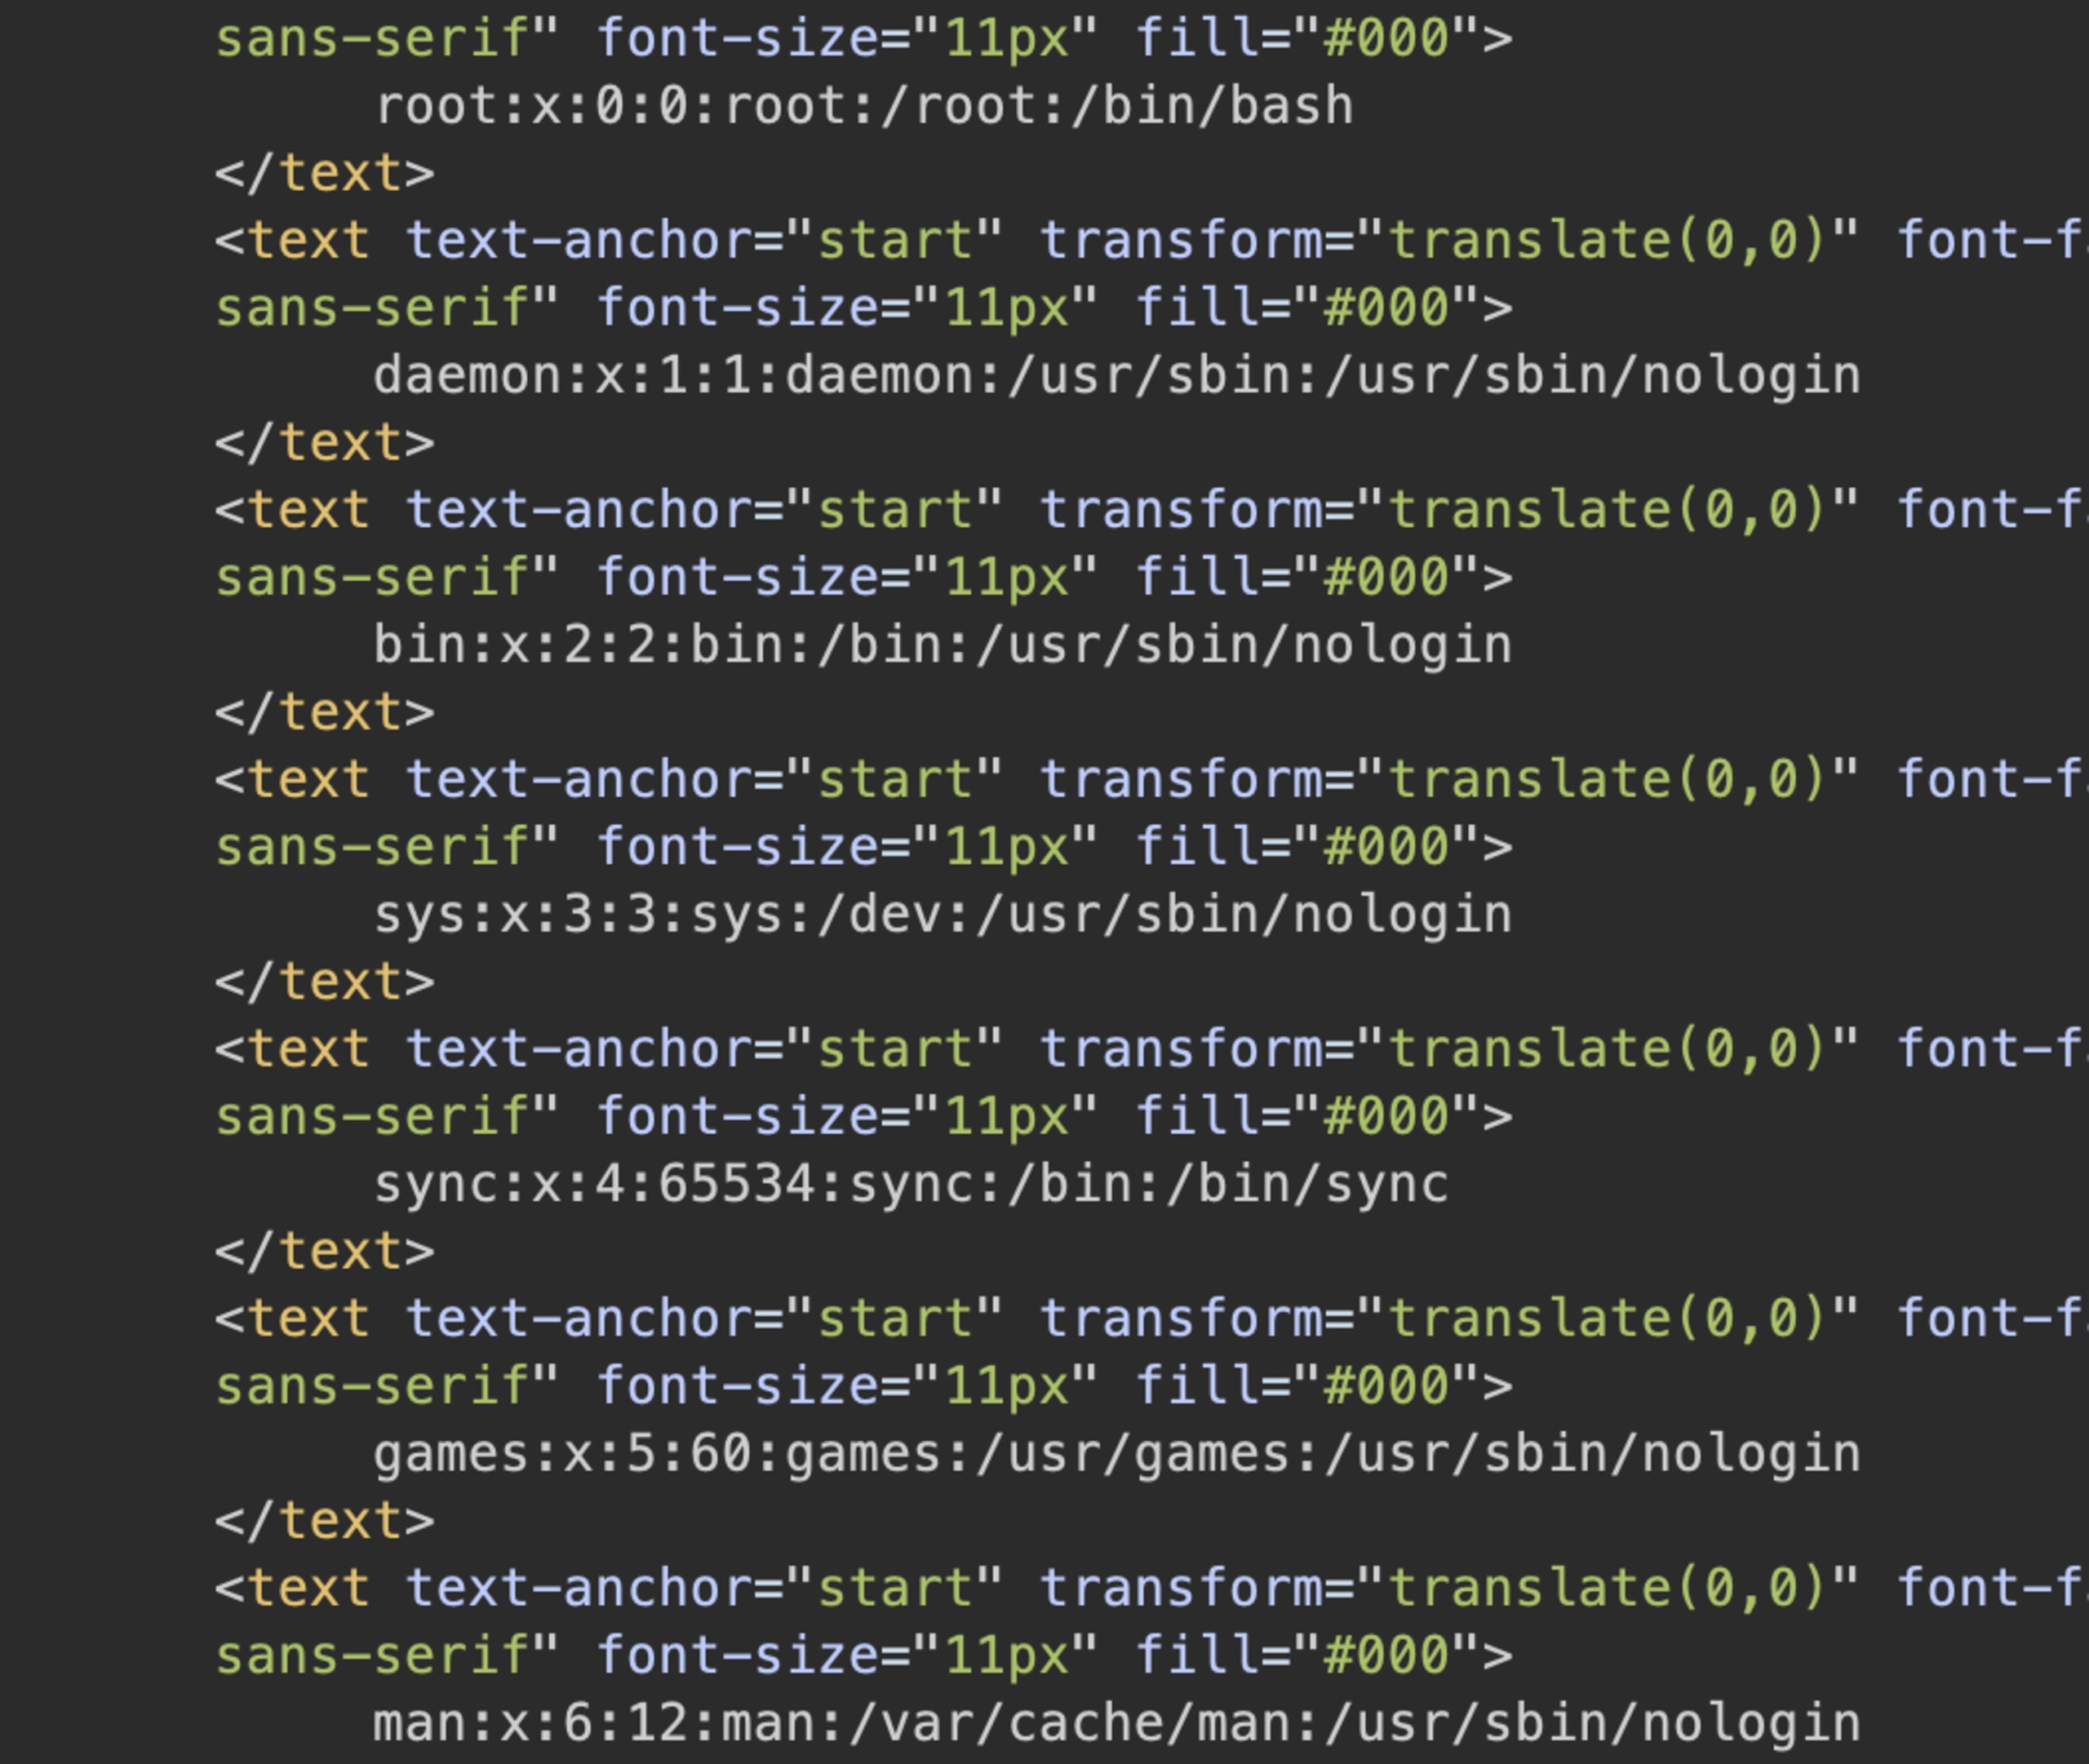
After setting up the data type, custom delimiter, and headers, and using signal to access each field, we can finally put everything together. We can use the final JSON payload to read the local file:
After sending the payload, the /etc/passwd file was successfully read, and all its contents were rendered in the diagram:
GitLab diagram rendering using Kroki
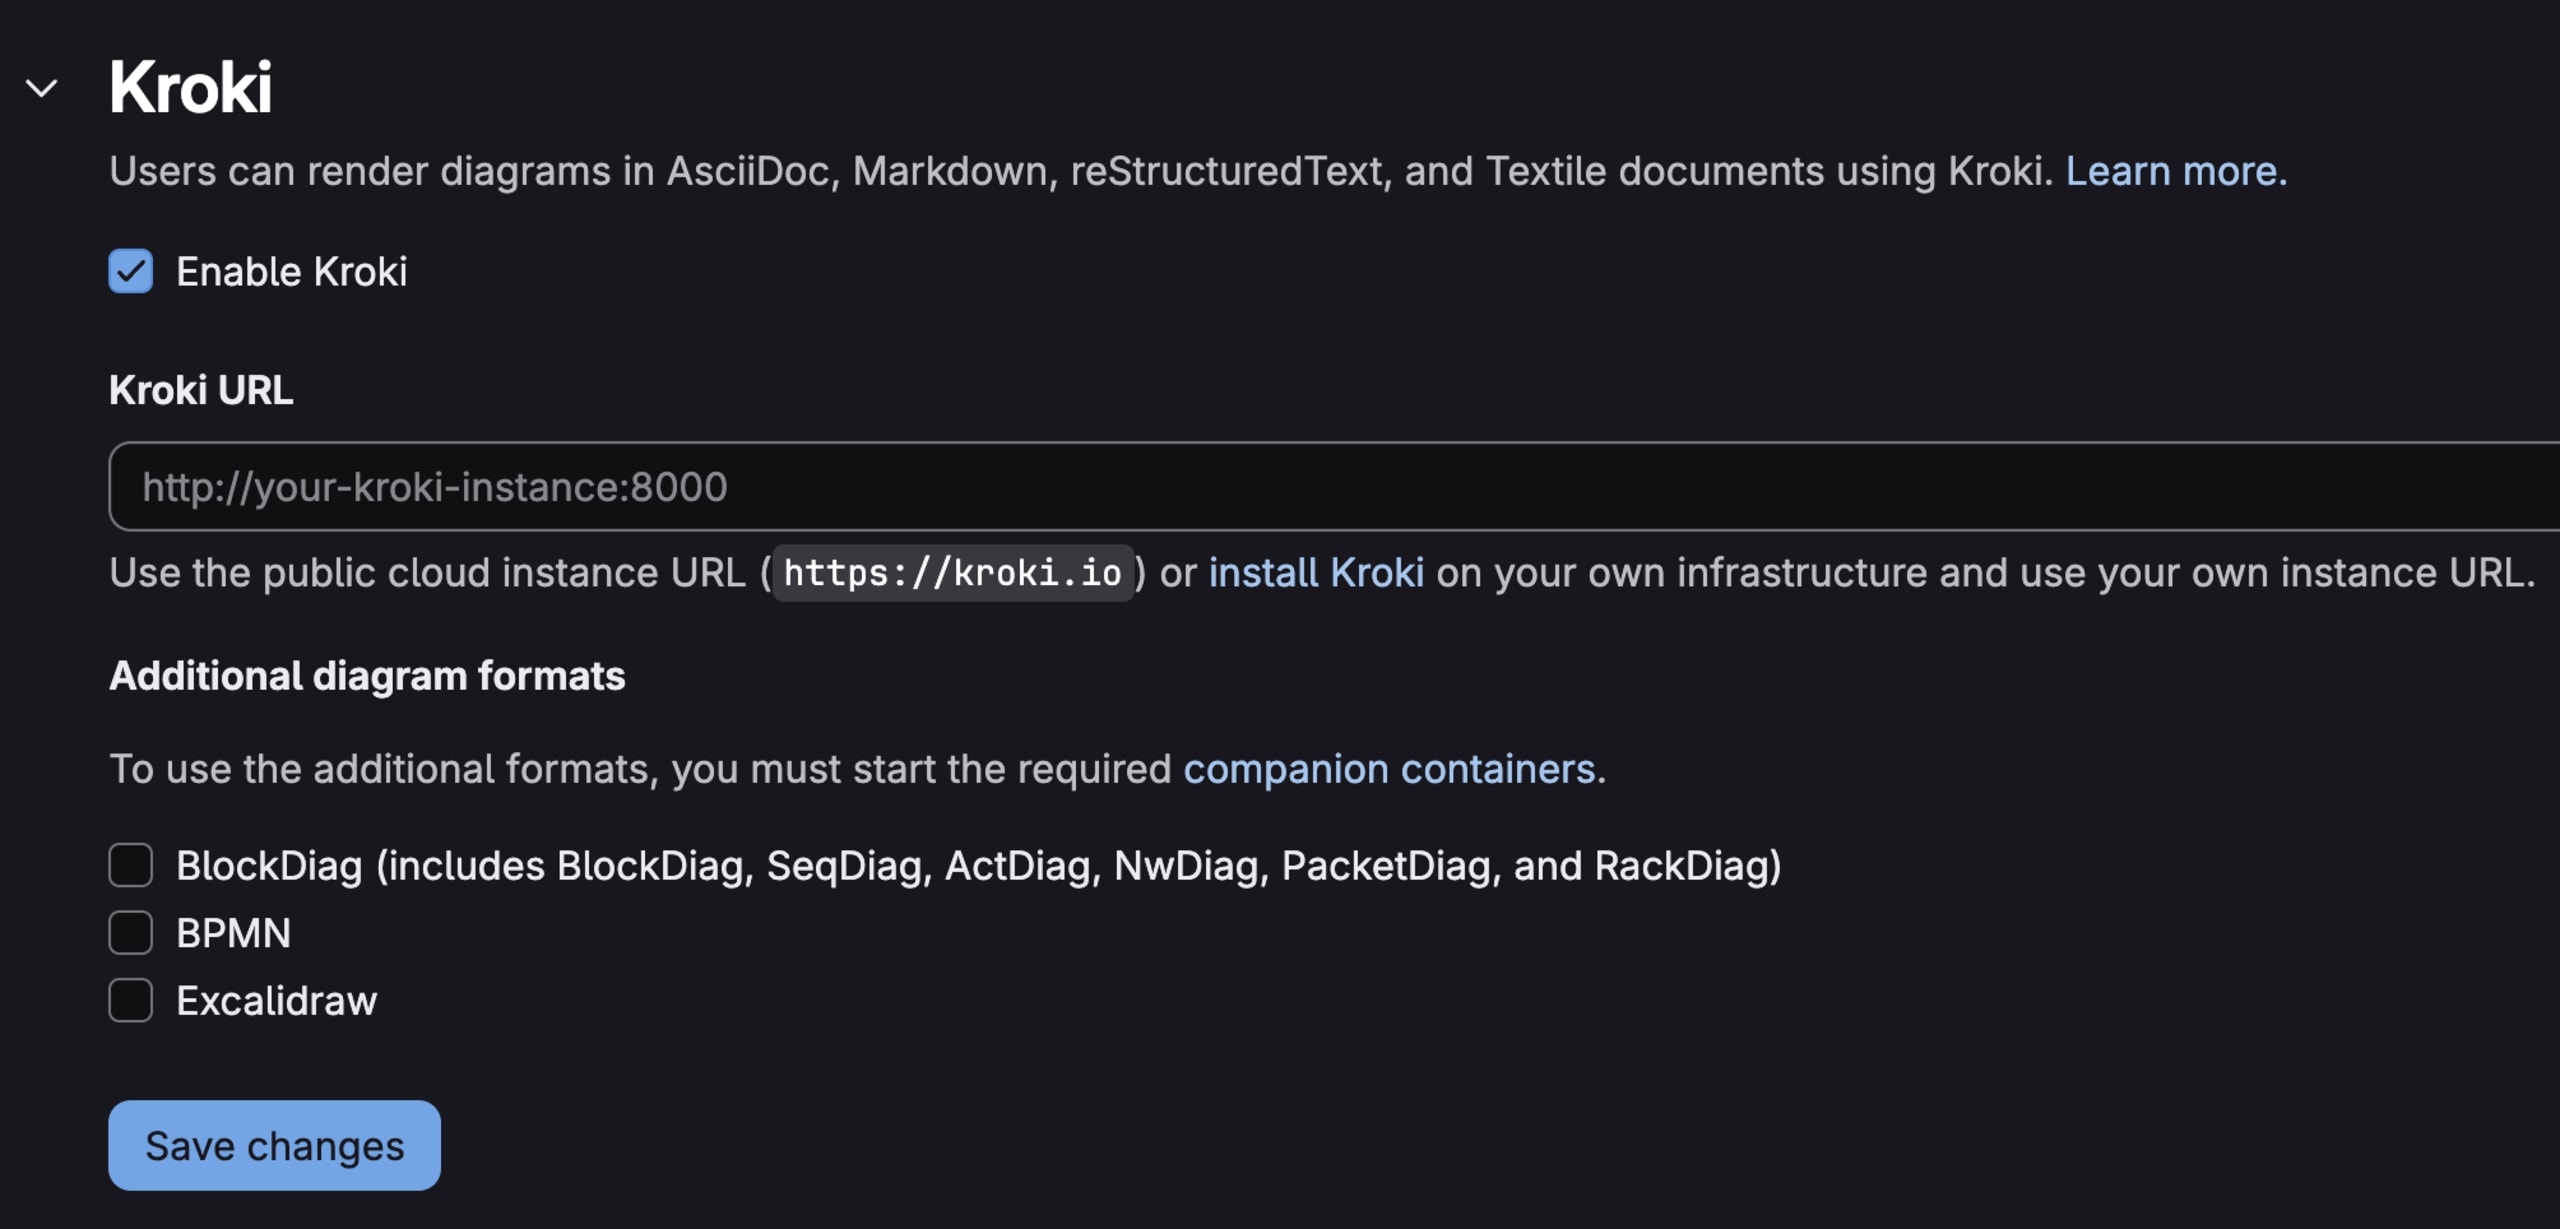
To see how this could be exploited in practice, we looked for applications that use Kroki for diagram rendering. GitLab is one example. Once a Kroki server is configured, GitLab automatically processes diagram blocks inside Markdown files.
To test this, we can drop our Vega payload into a simple README.md file in any repository. At the top of the code block, we have to specify the diagram type as vega, so GitLab knows how to handle it:
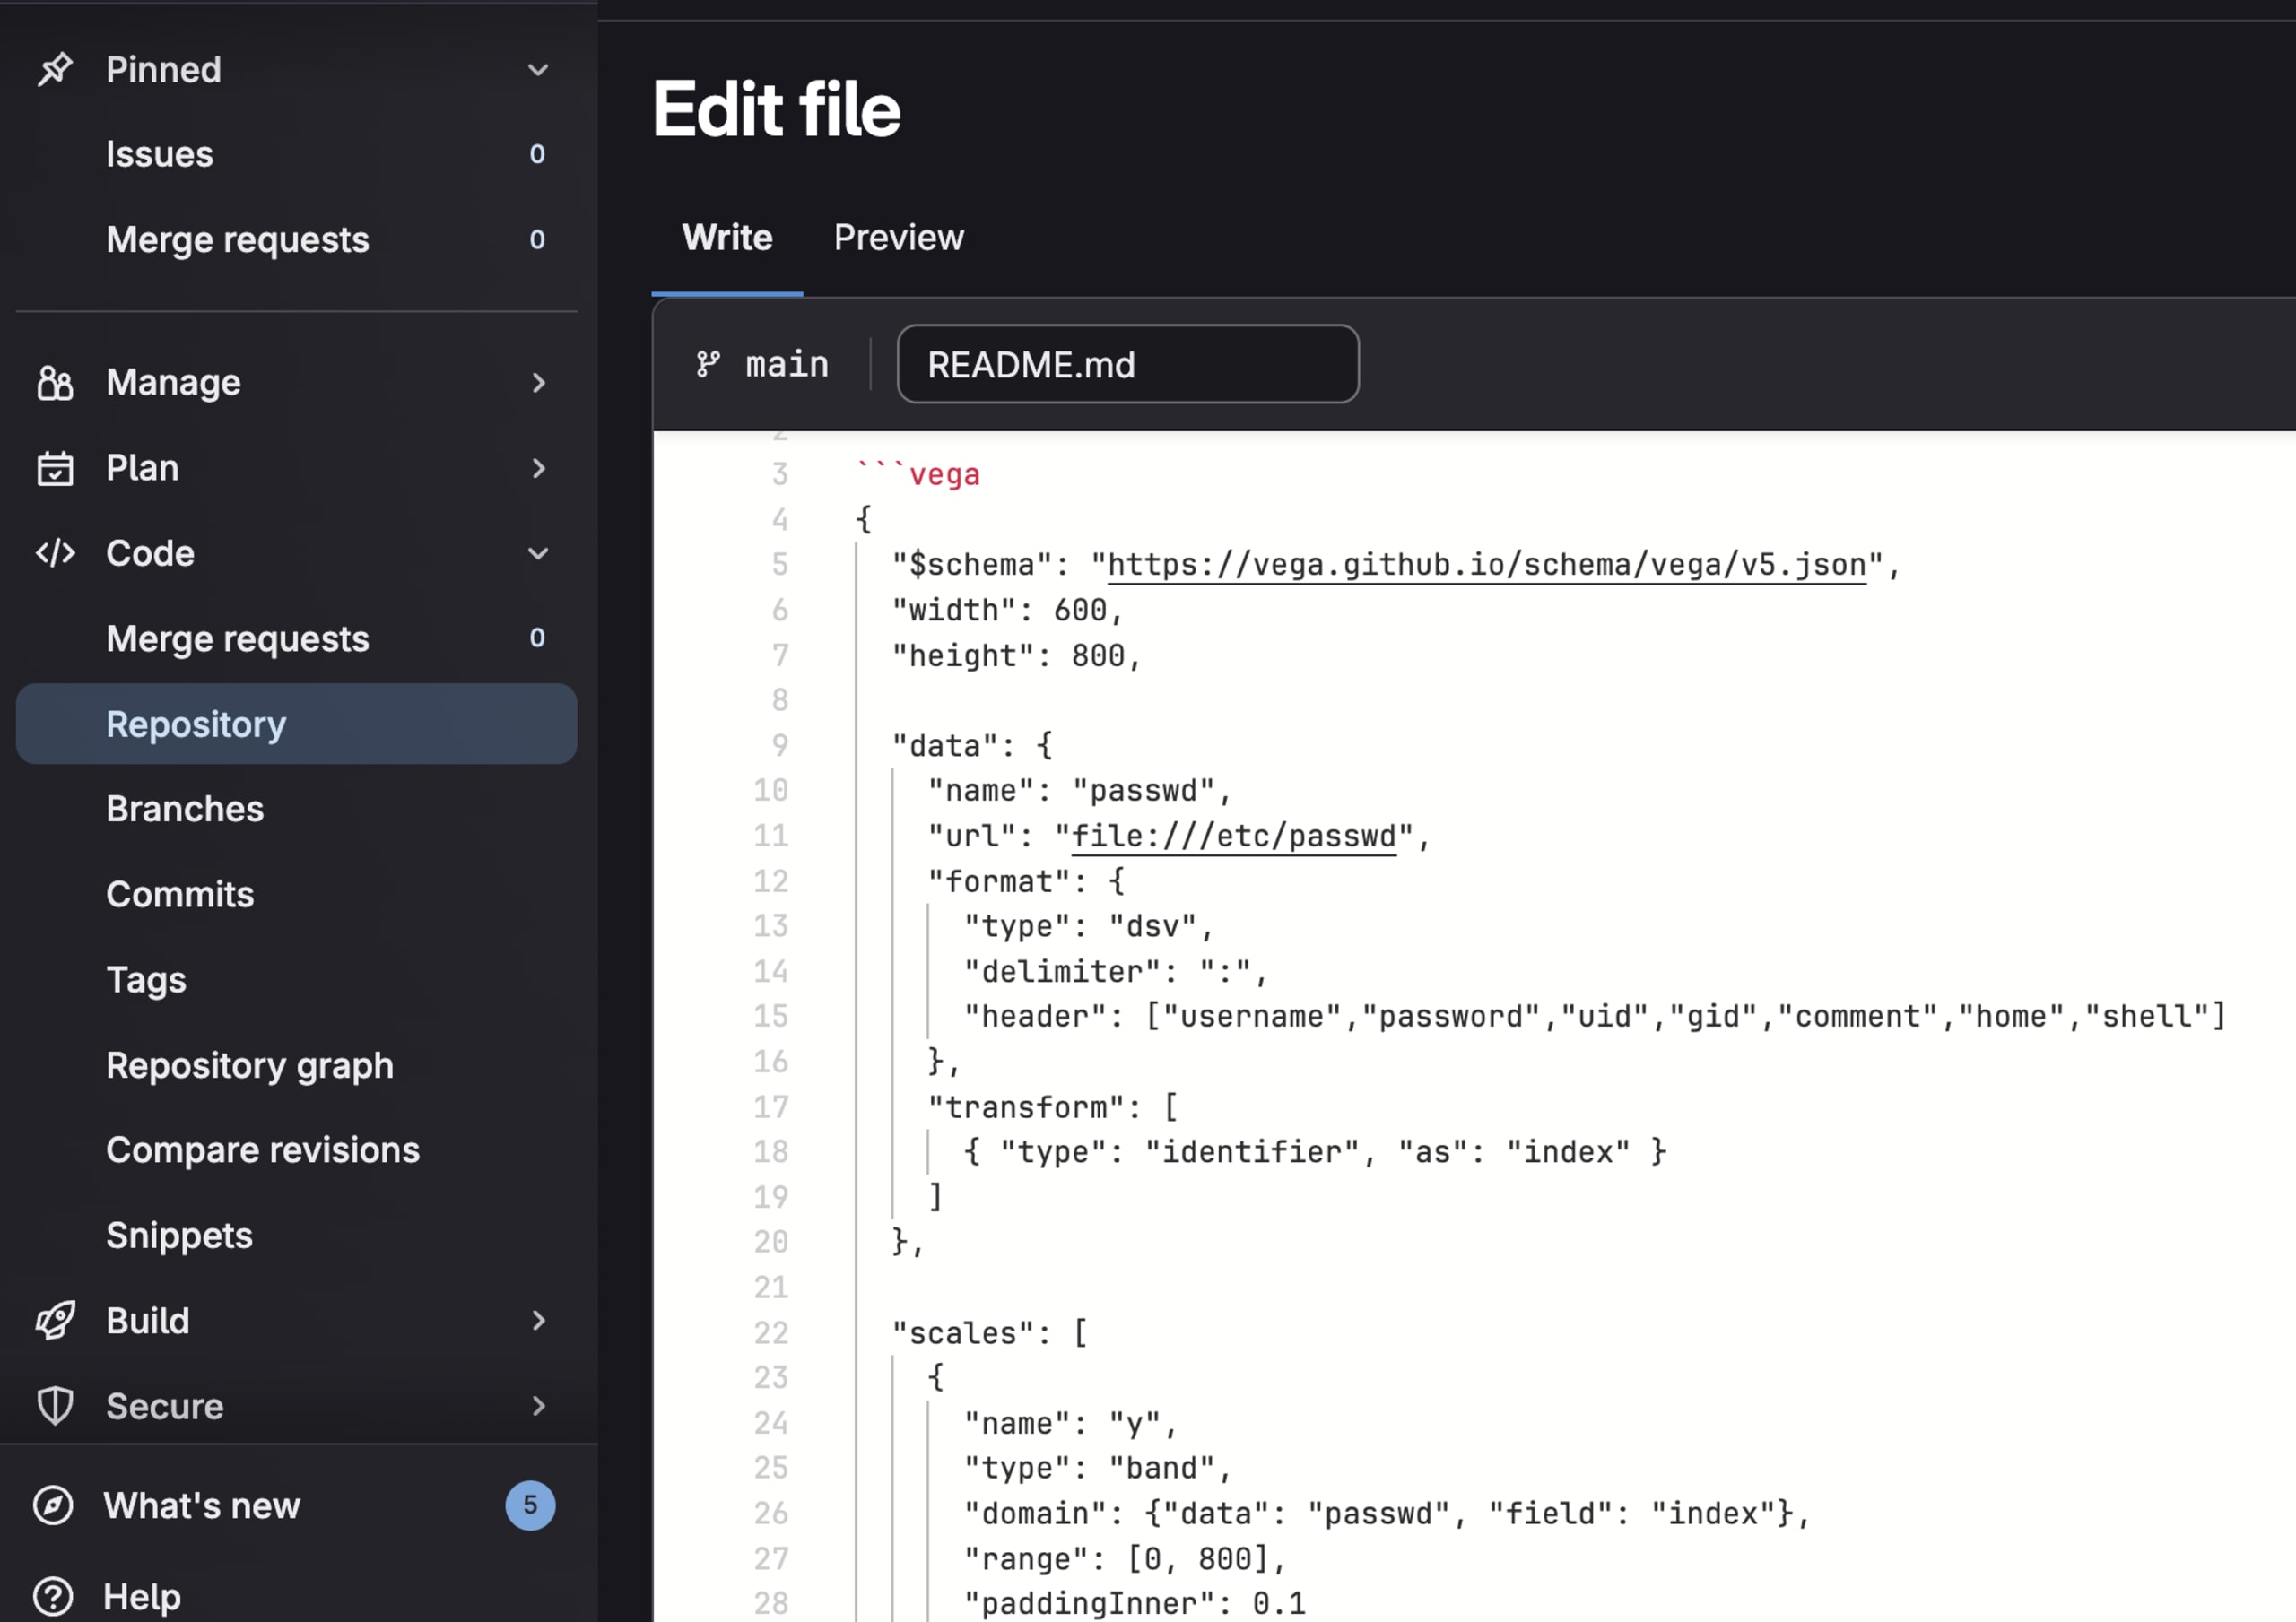
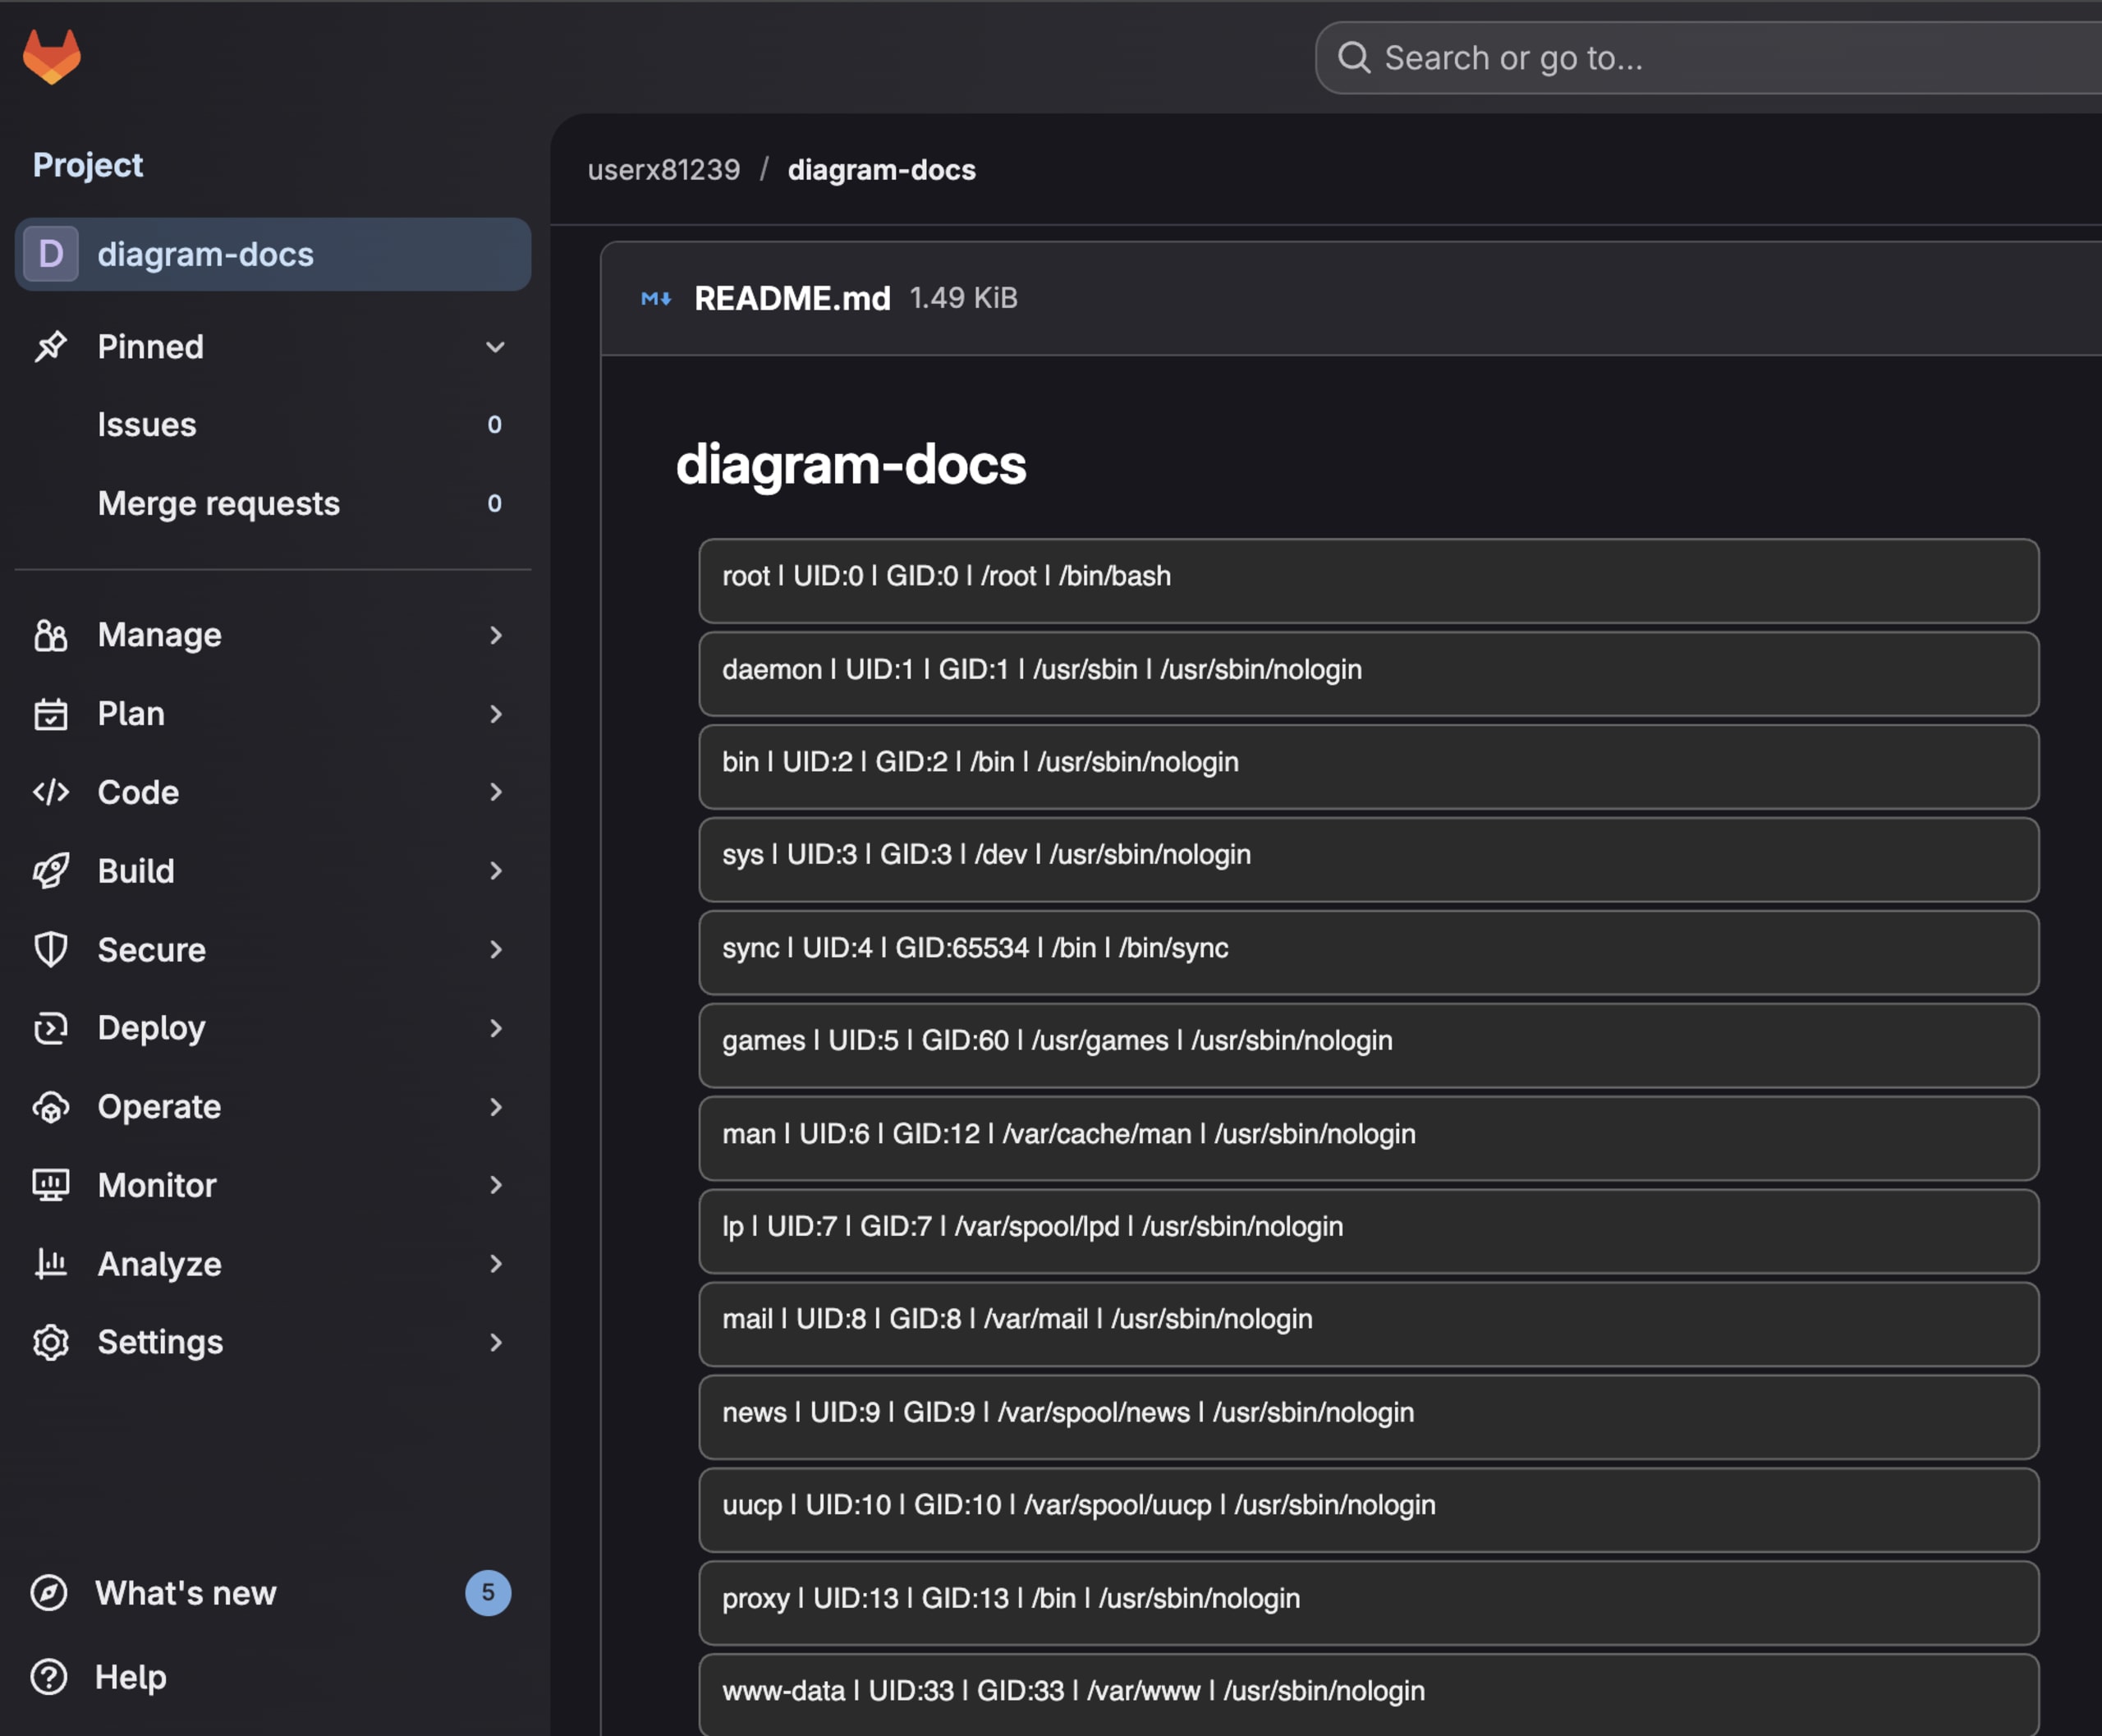
After committing the file, we can observe that the diagram was rendered and the /etc/passwd file shows up inside the Vega diagram:
Kroki was fixed in version 0.29.1 (CVE-2025-14896) by extending the safeMode validation to check both array and object formats of spec.data for URL attributes:
With Kroki, we could render arbitrary local files in Vega diagrams, showing how server-side rendering can be exploited to read files from the hosting server.
Next, let’s take a look at PlantUML, another popular tool for creating diagrams.
Bypassing dangerous protocol filtering in PlantUML
PlantUML supports directed graphs using DOT, the language used by GraphViz to describe nodes and edges. Since Graphviz performs no sanitization and simply processes whatever DOT text it receives, PlantUML must sanitize the input on its side to prevent XSS from slipping into diagram nodes.
For example, the following filter function tries to sanitize the interactive objects in the PlantUML diagrams:
src/main/java/net/sourceforge/plantuml/directdot/PSystemDot.java
The function uses the first regex to replace the javascript: pseudo-protocol and the second one to strip out script strings. However, this type of regex-based filtering can miss certain character encodings.
For example, using characters in decimal form can bypass the sanitization filter:
With a diagram like the one below, we could inject a malicious PlantUML payload and run arbitrary JavaScript in any app that renders the resulting SVG:
PlantUML was fixed in version v1.2026.0 (CVE-2026-0858) by disabling SVG export for DOT diagrams entirely, avoiding the sanitization problem.
Takeaways and mitigations
Diagram rendering introduces attack surfaces that are not always obvious. A simple visualization feature can become an entry point for XSS or server-side file access, depending on how and where the diagram is rendered.
Client-side rendering often includes interactive features like click handlers and links. When enabled, user input can flow directly into event bindings and href attributes.
If you render diagrams from untrusted sources, disable interactivity where possible. In Mermaid, this means using securityLevel set on strict or sandbox, rather than loose. If interactivity is required, sanitize the diagram source before rendering and pass the final SVG through a sanitizer such as DOMPurify before inserting it into the DOM.
Server-side rendering introduces its own risks. Diagram rendering engines may load external data, access local files, or make network requests. Kroki’s safeMode is a good example of mitigation, but as we saw with the Vega bypass, the implementation matters. Also, it’s worth isolating rendering services in containers with restricted filesystem or network access.
Regardless of the implementation, the diagram source should be treated as untrusted input, especially in applications where users can share or generate diagrams dynamically. A strict Content Security Policy (CSP) that disallows unsafe-inline can block javascript: URLs even if sanitization fails. When integrating third-party rendering services, it's worth reviewing their security configurations and understanding the capabilities of the underlying engines.


